SpecIRAF example (FITS)
This notebook demonstrates how to read an IRAF-style spectrum FITS file with SpecIRAF,
then plot, smooth, and trim the spectrum.
The object J001554.18+560257.5 is from the survey for quasars behind the Galactic plane (Fu et al. 2022, ApJS, 261, 32), and was observed with the 2.4m Lijiang Telescope (LJT) in China.
It expects the example file to exist at:
specbox/examples/data/spec_J001554.18+560257.5_LJT.fits
from pathlib import Path

import matplotlib.pyplot as plt

from specbox.basemodule import SpecIRAF

data_file = Path("../data/spec_J001554.18+560257.5_LJT.fits")
if not data_file.exists():
    raise FileNotFoundError(
        f"Missing example data file: {data_file}\n"
        "Add it under specbox/examples/data/ before running this notebook."
    )

spec = SpecIRAF(str(data_file))
spec.objname
'J001554.18+560257.53'
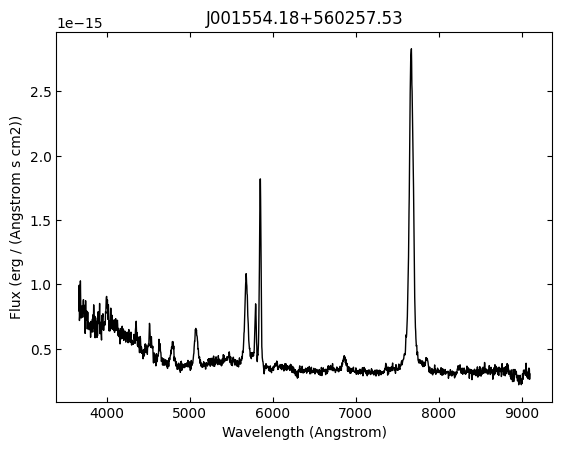
Plot
ax = spec.plot()
ax.set_title(spec.objname)
plt.show()
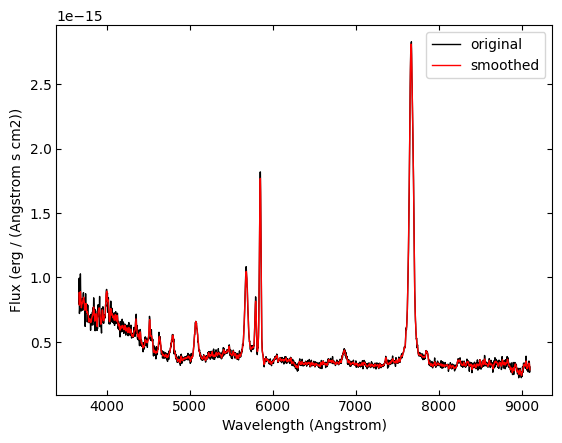
Smooth
smooth(..., inplace=False) keeps the original spectrum and returns the same object (it stores the
smoothed flux on spec.flux_sm).
spec.smooth(window_length=9, polyorder=3, plot=True, inplace=False)
plt.show()
Trim
Trim to a wavelength range (Angstrom). Use inplace=False to create a trimmed copy.
wave_min = float(spec.wave.value.min())
wave_max = float(spec.wave.value.max())

# Trim to the central 60% of the wavelength span as an example.
trim_range = (
    wave_min + 0.2 * (wave_max - wave_min),
    wave_min + 0.8 * (wave_max - wave_min),
)

trimmed = spec.trim(trim_range, plot=True, inplace=False)
plt.show()

trim_range
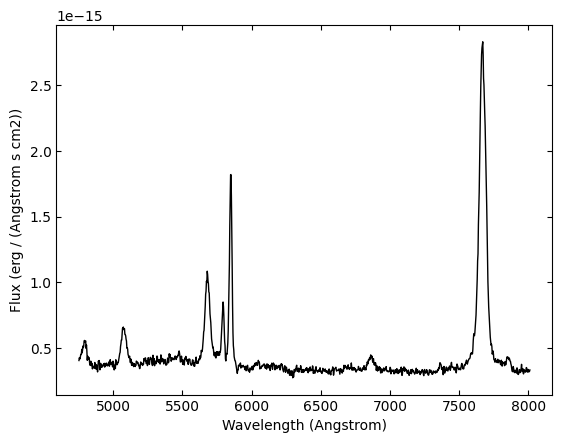
(4752.1895532183935, 8011.365667052776)